Key Website Metrics for Insurance Agencies
Most Important Website Metrics Insurance Agencies Should Monitor
As an insurance agency owner, your website is a key touchpoint for potential clients. But are you keeping an eye on the right metrics to ensure it’s working for you? The following guide covers the most important website metrics you should monitor to understand your site’s performance, attract more visitors, and convert them into leads.
1. Website Traffic
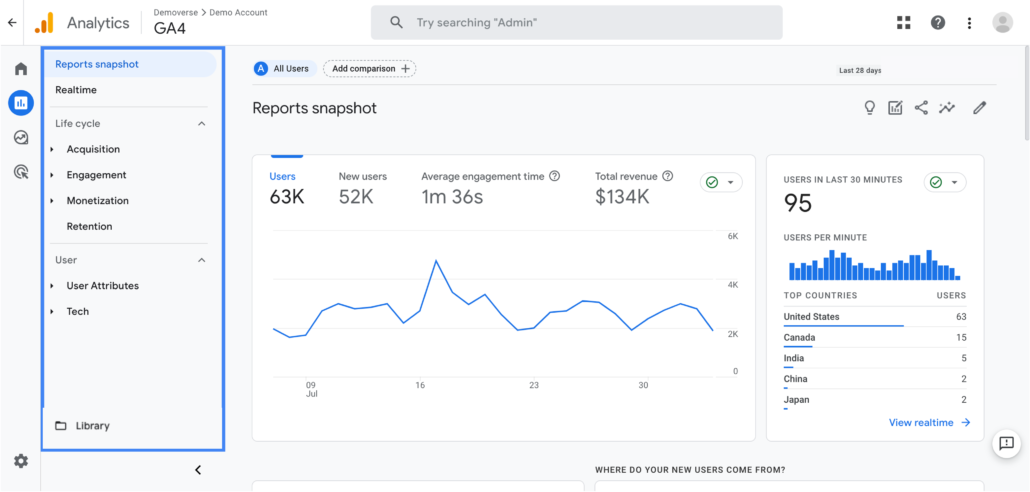
Website traffic is the most basic metric to monitor, providing an overview of how many visitors are landing on your site. You want to track the total number of visitors, but it’s equally important to dig into specifics, like where your visitors are coming from—whether it’s through organic search, paid ads, or social media. For insurance agencies, understanding traffic sources helps pinpoint what marketing efforts are driving people to your website.
Where to find it:
Google Analytics is the go-to tool for tracking website traffic. You can get detailed reports by navigating to the “Acquisition” tab to see traffic sources and trends. Here’s a guide to setting up Google Analytics if you haven’t yet.

2. Bounce Rate
Your bounce rate measures the percentage of visitors who leave your website after viewing only one page. A high bounce rate can signal that the page didn’t capture their attention or wasn’t relevant to their search. For insurance agencies, this could mean potential clients are landing on your page but not finding the information they need. To reduce your bounce rate, make sure your website has clear, engaging content and easy navigation.
Where to find it:
Google Analytics has a bounce rate metric under the “Audience Overview” section. For specific page insights, go to “Behavior” > “Site Content” > “All Pages.”
3. Conversion Rate
This is arguably the most critical metric for an insurance agency’s website. Conversion rate measures the percentage of visitors who complete a desired action, like filling out a quote form, subscribing to a newsletter, or contacting your agency. If your conversion rate is low, you may need to rework your call-to-action, form design, or overall user experience.
Where to find it:
Google Analytics allows you to set up “Goals” to track conversions under the “Conversions” tab. You can define what counts as a conversion, such as form submissions or phone calls. Here’s a step-by-step guide to setting up Goals.

4. Page Load Speed
Nobody likes a slow website, and your potential customers are no exception. Page load speed is a crucial factor for both user experience and search engine ranking. If your site takes too long to load, visitors will leave before it even finishes. In the insurance industry, where trust and professionalism are key, a fast-loading site can make all the difference in a prospect’s first impression of your agency.
Where to find it:
You can test your page load speed using Google’s PageSpeed Insights. This tool will also provide suggestions on how to improve speed if your site isn’t performing well.
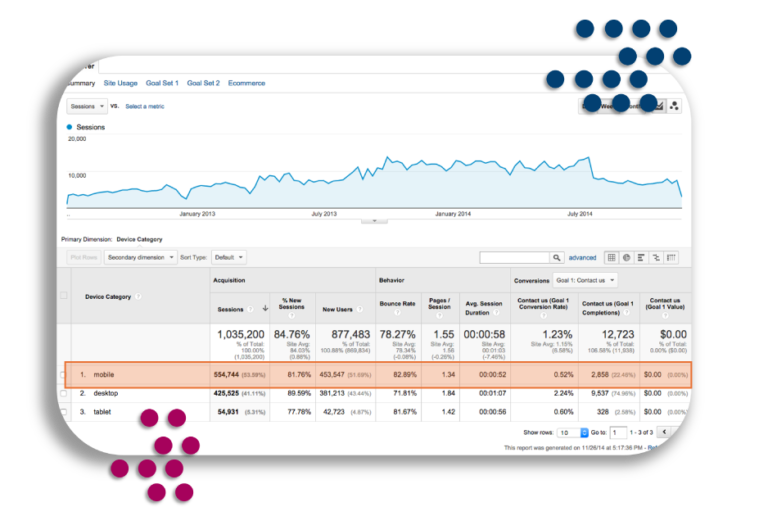
5. Mobile Traffic
Given that a significant number of users browse websites on their mobile devices, especially when searching for services like insurance, tracking mobile traffic is essential. If a large percentage of your visitors are coming from mobile devices but not converting, it may be a sign that your mobile experience is lacking, and adjustments like a responsive design may be needed.
Where to find it:
In Google Analytics, you can monitor mobile traffic under the “Audience” > “Mobile” > “Overview” section. This will show how many visitors are coming from smartphones or tablets and how their behavior compares to desktop users.
6. Session Duration
Session duration measures how long visitors stay on your website during a single visit. The longer visitors stay, the more likely they are to engage with your content or take an action like requesting a quote. Insurance agencies can benefit from this metric as it helps gauge the overall user experience—whether visitors are finding your content helpful and worth their time.
Where to find it:
Google Analytics provides session duration metrics under “Audience Overview.” You can also break it down by individual pages in the “Behavior” section.
7. Click-Through Rate (CTR) on Call-to-Action Buttons
Your call-to-action (CTA) buttons—whether it’s “Get a Quote” or “Contact Us”—are vital touchpoints for converting visitors into leads. A low CTR on these buttons means your visitors aren’t engaging with the actions you want them to take, which could indicate a need for clearer messaging, design tweaks, or better placement.
Where to find it:
You can use tools like Google Tag Manager to track clicks on your CTA buttons. Once set up, you’ll be able to measure which buttons are performing well and which might need improvement.
8. Form Completion Rate
For insurance agencies, online forms are often the main way to capture leads. Tracking form completion rates helps you determine if visitors are having trouble completing your forms or if there are too many fields. If you notice a high abandonment rate, it might be time to simplify the form or break it down into steps to make it less overwhelming.
Where to find it:
Google Analytics Goals can be set up to track form submissions. Alternatively, tools like HubSpot offer in-depth form tracking and analytics.
Final Thoughts
Monitoring these key metrics will help you stay on top of your website’s performance, ensuring it’s optimized to attract and convert potential clients. With tools like Google Analytics, PageSpeed Insights, and HubSpot, you can easily track and improve your website’s effectiveness, making sure every visitor counts.